Fundamentals
Many webmasters have encountered the issue of slow website access speeds. Today, let’s try to understand and resolve this problem. First, let’s discuss what actually happens between the moment we enter a URL in a browser and the moment the webpage appears.
First, before an HTTP request is made, the following steps occur:
- IP Resolution. After entering a URL in the browser’s address bar and submitting it, the browser first checks the local DNS cache. If found, it retrieves the IP address directly. If not, it queries the gateway DNS, and so on, until the corresponding IP is found and returned to the browser.
- Establishing a TCP Connection. Once the IP is obtained, a three-way handshake is performed with the requested server to establish a TCP connection.
- After the connection is established, an HTTP request is sent to the server.
During the HTTP request, the page file is retrieved first. The browser then parses resource files referenced within the page, including CSS, JS, images, etc., and sends additional requests to fetch these resources. In HTTP 1.1, multiple requests can be pipelined, but the page file must be received first to determine which resource files need to be requested.
Therefore, the entire process consists of several stages:The first stage is Time to First Byte (TTFB), which is the duration from the URL request to when the server returns the response content after receiving the HTTP request. This includes not only DNS lookup and connection establishment time but also, for dynamic pages, the time required for the server to execute dynamic code and return the page content. Thus, computation and database operations directly increase TTFB. For static files, TTFB is usually quite fast. However, if network connectivity to the server is poor—for example, if the server is located overseas—it can result in significant latency.
In Alibaba Cloud’s CloudMonitor, you can configure arbitrary HTTP monitoring points to track server response times. For instance, I set up monitoring for two websites hosted on the same server:
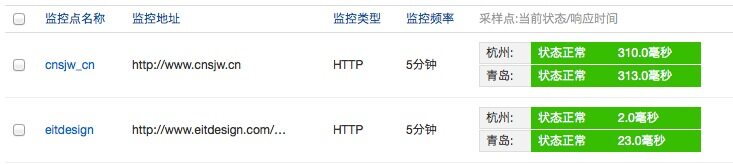
Here, it is evident that for WordPress, which requires database calls, the response time is significantly longer than for eitdesign below, which only uses simple XML reading. For eitdesign, the response time is virtually instantaneous. This demonstrates the impact of physical distance to the server: since the server is in Hangzhou, accessing it from Hangzhou takes only 2ms, whereas accessing it from Qingdao takes 23ms. As for the round-trip response time to the server, it can be measured using the ping command.
Speaking of the ping command, many people use it merely to check if a server is reachable… Let’s first explain how ping works: it sends an ICMP Echo Request message to the destination and reports whether the expected ICMP Echo Reply was received.
Theoretically, the recipient should reply with data of the same size as the ping packet sent, making it easy to assess the communication status with the server.
Therefore, if the ping response time has been stable but suddenly fluctuates, it may be due to sudden bandwidth saturation. By combining this with server resource monitoring, you can easily identify the source of the problem.
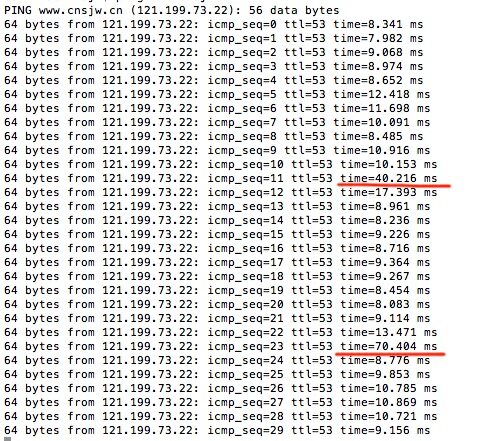
By continuously refreshing the page while running ping, you may observe moments where latency spikes noticeably; this indicates that bandwidth was fully saturated at that instant.
The second stage is the time taken to receive the page file. Before the page file is received, no resource files are requested because the browser does not yet know which resources the page contains. Therefore, this period is also critical.
The third stage is the time taken to fetch various resource files in the head section. Resource files are loaded in the order they appear in the HTML page, so resources in the head are loaded first. The head primarily contains CSS and JS files, and the page will not render until these are loaded. Therefore, special attention should be paid to the loading time of resources in the head. After all, users see a blank screen until the page renders.
The fourth stage is the time taken to fetch the remaining resource files. This part mainly consists of images, animations, videos, and other files. It is less critical since the page has already rendered, and most users find it acceptable to wait a few seconds for these elements to load.
There is also page rendering time, but since it occurs concurrently with loading and is typically not slower than the loading process itself, it can be ignored.
Testing Tools
To visualize this data intuitively, you can examine the page timeline, also known as a waterfall chart. Most modern browsers include built-in debugging tools that support this feature. Taking this website and Safari as examples, refer to the image below:
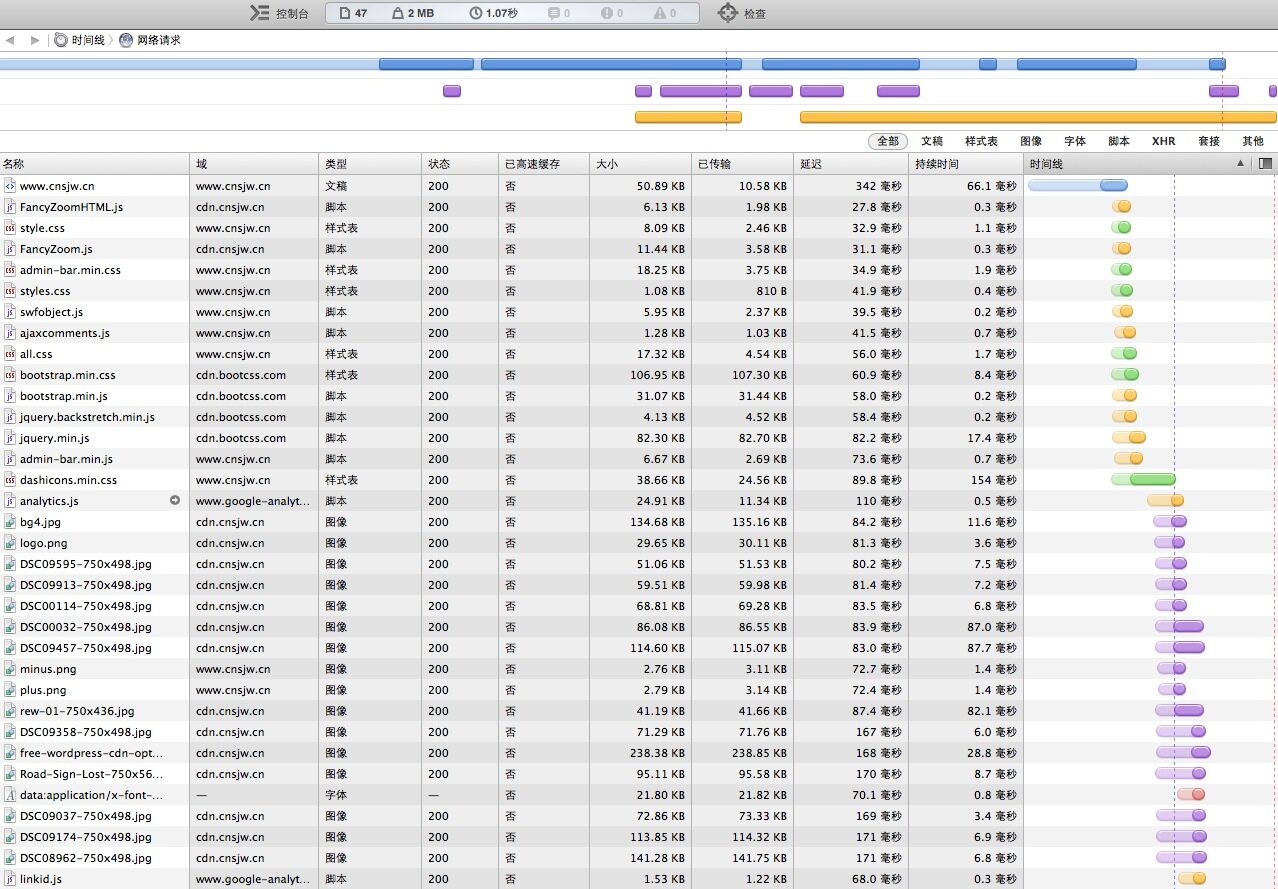
First visit (in Safari, you can bypass the cache by holding Shift + clicking the Refresh button):
Subsequent visit:
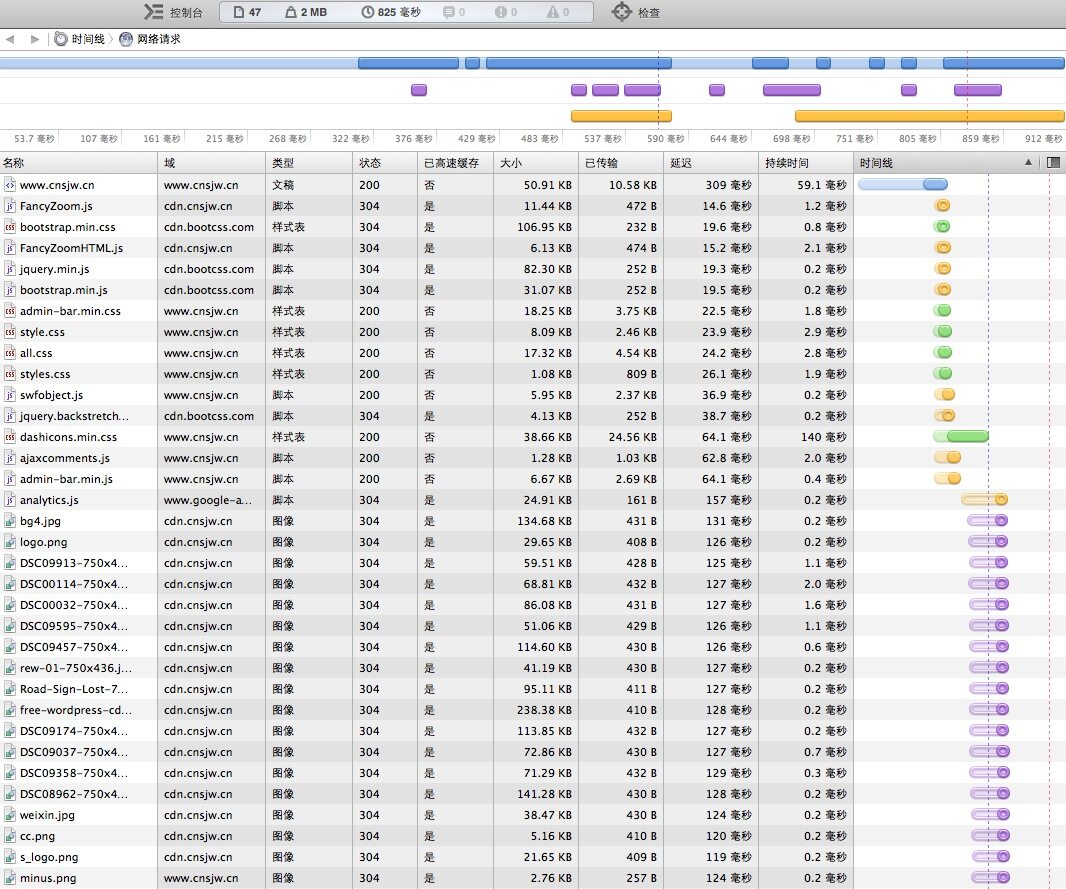
As clearly shown in the chart, 47 resource files were requested, totaling 2MB of data. The first visit took 1.07 seconds, while the subsequent visit took 825ms. Let’s first discuss the initial visit:
The blue entry in the first row represents the page file, with a total size of 50.89KB and a compressed transfer size of 10.58KB. The response time was 342ms, and the load time was 66.1ms. After this file is parsed, requests for individual resource files begin.
You can see two dashed lines here: the blue line indicates the DOMContentLoaded event trigger time at 635ms, meaning the browser has finished parsing the document (though other resources like images may not have finished downloading). The red line indicates the Load event trigger time at 1.07 seconds, meaning all resources have finished loading.
During the first visit, all resources must be requested. On subsequent visits, local cached data can be leveraged to speed up resource loading. Therefore, setting an expiration time for infrequently changing static resources tells the browser not to reload them for a specified period. This accelerates subsequent user visits and significantly reduces the duration of the fourth stage.
This timeline can be viewed not only in local browsers but also on relevant testing websites, such as Alibaba’sAliTest, as well asGoogle PageSpeedandYahoo YSlow. There is also a tool calledGTmetrix, which combines Google PageSpeed and Yahoo YSlow, and is also a great utility. These sites also provide optimization suggestions tailored to your site.
Another tool called17CEallows you to test response times and ping latency simultaneously from test servers in different regions, helping you understand access speeds for users across various locations.
Optimization Methods
Now that we have covered the relevant fundamentals and tools, we can proceed with targeted optimizations. Below, we will discuss how to optimize each stage:
Stage One: Server Response Time. There aren’t many generic solutions for this part. For dynamic websites, optimization primarily focuses on algorithms and database tuning, as well as using AJAX for asynchronous data fetching. These are backend concerns and won’t be discussed in detail here. However, if a server’s response time exceeds 2 seconds, it can generally be considered unresponsive. Typically, it should be kept under 500ms. While the difference might not feel significant to users, keeping it under 250ms is even better.
Stage Two: Fetching the Page File. Page files are usually small and consist of plain text. Therefore, the optimization method is to enable Gzip compression. For Apache, first remove the ‘#’ before ‘LoadModule deflate_module modules/mod_deflate.so’ in httpd.conf, restart Apache, and then add the following to .htaccess:
<IfModule mod_deflate.c>
	AddOutputFilter DEFLATE html xml php js css text/html text/plain
</IfModule>
Gzip compression is quite effective for loosely structured plain text; for example, my homepage was compressed from 50KB to 10KB.
Additionally, use external linked CSS files instead of embedding stylesheets directly in the HTML page. This allows CSS files to be cached.
Stage Three: Resource Files in the Head. These are primarily CSS and JS files. Optimization methods include:
- Use GZip compression.
- Use minified JS and CSS. Keep original versions for editing and output minified versions for production. Although less readable, the file size is significantly reduced.
- Combine multiple CSS and JS files to reduce the number of HTTP requests.
- Move unnecessary JS files to the bottom of the page. For JS files that do not affect rendering, deferring their loading to Stage Four can reduce page display time.
- Set cache expiration times for infrequently updated files and utilize OSS or CDN.
Stage Four: This stage involves the largest volume of data. Nowadays, user bandwidth is rarely the bottleneck; the constraint usually lies with the server. Consider this: if a page requires 2MB of data to load completely and the server’s outbound bandwidth is only 1Mbps, ignoring other latencies, it would take at least 16 seconds to transfer that 2MB for a single user. This is unacceptable for users.
Therefore, for Alibaba Cloud ECS instances, especially monthly subscriptions without high bandwidth, you should minimize resources served directly from the ECS. Key methods include using OSS storage, CDN acceleration, and GZip compression. Specific optimizations require meticulous effort to minimize data served directly from the ECS. However, WordPress can be tricky; some system-native and plugin-referenced JS and CSS files are difficult to merge or relocate… We can only optimize as much as possible. Take my website as an example: previously, even after moving all images to a CDN, loading the homepage still required about 220KB of data to be served from the ECS. With only 1Mbps bandwidth, this took at least 2 seconds. Later, I moved all theme images, Bootstrap, and jQuery to the CDN, combined with GZip compression. After optimization, only 80KB of data remains, ensuring the page loads in under 1 second.
Other points to note include:
- Compress image sizes as much as possible without compromising quality.
- If displaying small images, do not resize large images via HTML/CSS; use appropriately sized images directly.
- Where possible, use a separate cookie-free domain for static files.
For high-traffic websites, saving every byte becomes even more critical. There are many more optimization techniques available; refer specifically to the evaluation results from Google PageSpeed and Yahoo YSlow. Note that since their servers are located overseas, response times may be significantly higher, so you can disregard that specific metric.
Finally, let’s discuss how to set cache expiration times. For Apache, first remove the ‘#’ before ‘LoadModule expires_module modules/mod_expires.so’ in httpd.conf, restart Apache, and then add the corresponding code to .htaccess to set cache durations for different file types. The example below sets a 1-month cache for image and JS files, and a 1-year cache for icon files:
<IfModule mod_expires.c>
	ExpiresActive On
	ExpiresByType image/jpg "access plus 1 month"
	ExpiresByType image/jpeg "access plus 1 month"
	ExpiresByType image/gif "access plus 1 month"
	ExpiresByType image/png "access plus 1 month"
	ExpiresByType text/x-javascript "access plus 1 month"
	ExpiresByType application/x-shockwave-flash "access plus 1 month"
	ExpiresByType image/x-icon "access plus 1 year"
</IfModule>
Side Note
Actually, this article was inspired by a minor glitch with an Alibaba Cloud server. One day, response times became extremely long, triggering CloudMonitor alerts. When I checked, response times had momentarily exceeded 15 seconds…
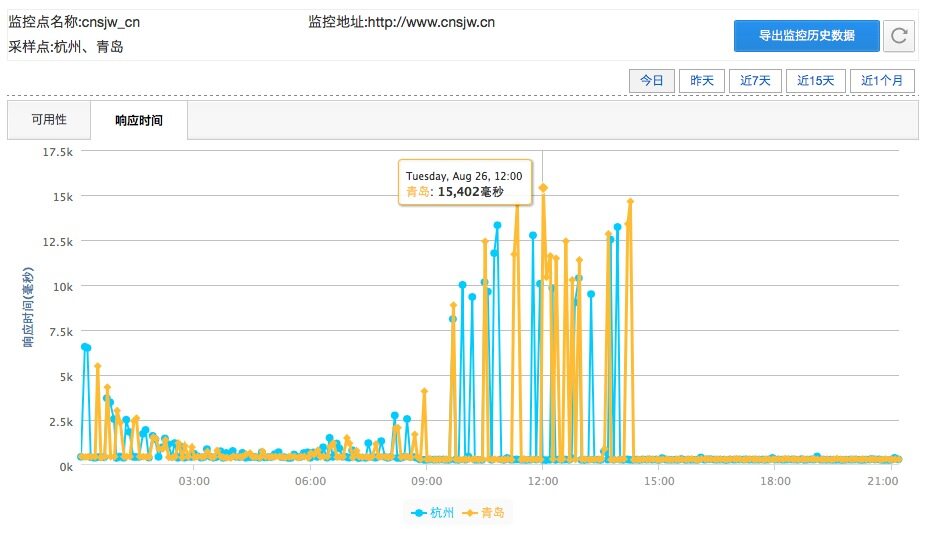
Wondering what was happening, I tried every possible method to optimize my website. Although the issue was quickly resolved, it gave me the opportunity to re-study various aspects of page acceleration. It made me acutely aware of just how limited 1Mbps bandwidth really is…
I hope you find useful insights in this article and give your own website a little speed boost~~~


Support
